pic courtesy: http://en.people.cn/n3/2018/0702/c98649-9476868.html
Several LLM models were utilized in the compiling of this data.
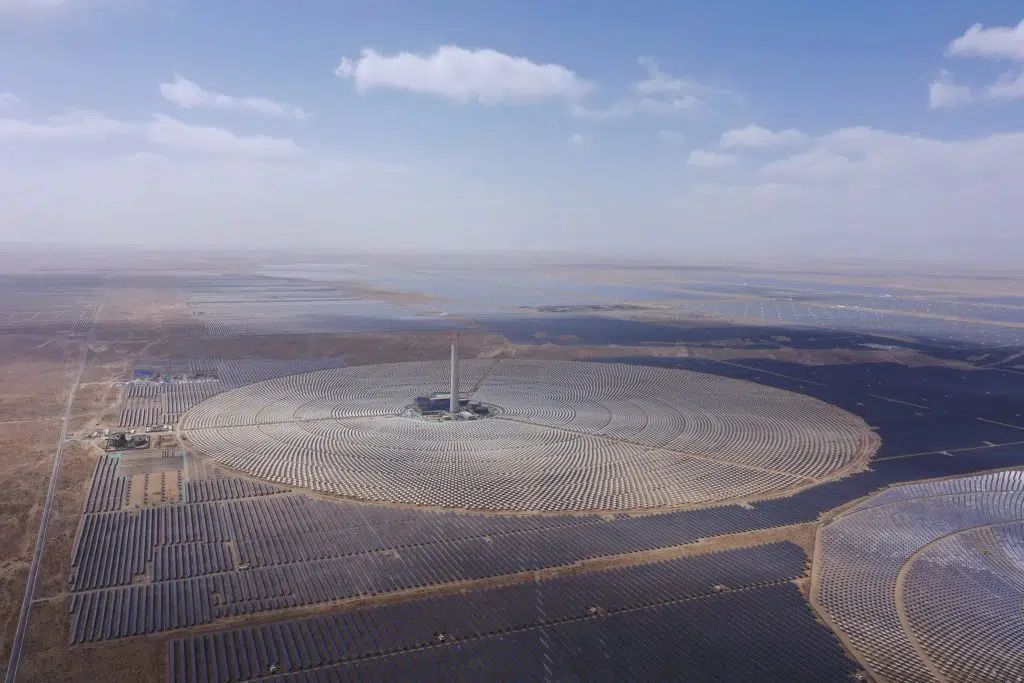
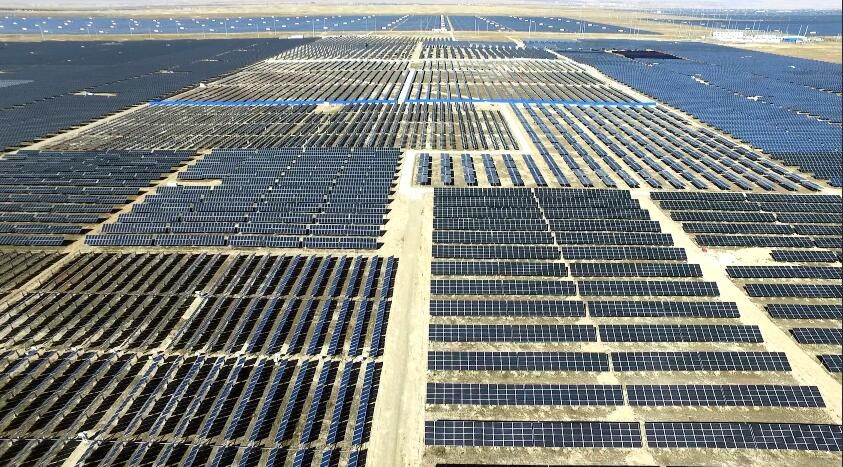
Gonghe Solar Park, located in Qinghai Province China, continues to expand and could potentially be the size of ten (10) Manhattan’s. Covering about 609 km² and boasting a capacity of 15.6 GW, over 7.2 million panels, it generates approximately 17,898 GWh annually.
For a better understanding, Gonghe Talatan Solar Park is about 162 square miles in area, while the city of San Diego covers roughly 340–370 square miles. So the park is a bit under half the physical size of San Diego, yet its annual electricity output is on the same order as the consumption of roughly 1.7 million average U.S. households, similar to the number of households in a large city like San Diego.
The average US household consumes about 10,500 kWh per year, based on EIA data. Dividing the park’s output yields roughly 1.7 million homes powered (17,898,000,000 kWh / 10,500 kWh). However, that’s only for homes, not infrastructure: offices, plants, transit, ports, data centers, hospitals, factories.
Solar panels as used for powering a city is not feasible, as the amount of land required to power just the homes is about the size of the land all the people live on. And Gonghe park is located 10,000 feet above sea level in a cold dry desert. So never be fooled by politicians, now or in the future, about the benefits of “solar parks” – it’s all hot air. On a last note for solar panels, the cost for building the panels in the U.S. is 3-5x higher than for China – simply not cost effective.
Although investors are told the panels “are good for 25 years,” the reality is technology advancement makes the panels obsolete every six months in our polarized speed of technology currently under Moore’s law. As will be learned in this article, electricity expansion for data center tech, along with AI advancement will make every solar panel the world over completely obsolete against new developments a year from now.
If you’re an investor don’t get scammed by solar park investments. If there is no attachement to the panel park, such as powering a hospital, factories, or transit, then you’re wasting your time on harvesting energy unless you have vast amounts of desert land or “Greenland” to put to use, specifically at higher elevaton to maximize energy output.
What governments can do in a scenario such as this, hundred+ mile long solar parks, is slap down a data center in the midst of this wasteland to power their AI and cloud service grid. They would have to build the infrastructure to accommodate staff and all the perks that would be required for IT personnel to live, as well as medical facility, fire department, etc,. This would require additional powerhouse, (generate electric from dynamo), and diesel backup systems.
You’ll also need shops, entertainment, restaurant, and religious services to keep park facility staff from going completely bonkers.
In the U.S., as you’ll learn in this article, building these massive data centers will consume vast amounts of hydro and cause the surrounding urban dwellers to experience electrical costs as high as mortgages in the near future. I’m sure you’ll be seeing politicians telling us they’re going to lower mortgage costs, due to the fact your electrcial costs in nearby cities will double and triple in cost.
It’s a game no one can fool you on once you start absorbing the costs. You will be billed for company progress as the government and your taxes pay for the labor, construction, and costs of these data centers. I would suggest the guys building these massive data centers go live in Greenland rather than take over your cities, but that’s up to you to decide how to handle.
Now let’s get on to the main article for those of you still intelligent enough to read or using AI to summarize for you.
Based on data from the EIA Annual Energy Outlook 2025, IEA Electricity 2025 report, BP Energy Outlook 2025, and Ember’s China Energy Transition Review 2025, below is a comparison of electricity generation (in TWh) for the US and China. Current figures are for 2024-2025 (using 2025 estimates where available), and projections for 2030 are based on reference or current trajectory scenarios.
China’s total generation is approximately 2.4x that of the US in 2025, not 5x, though its installed capacity is closer to 3.2x (China ~3,900 GW vs. US ~1,200 GW in 2025). Primary energy consumption (in EJ) is also included at the end for broader “energy output” context, as electricity is a subset of total energy. Oil/petroleum plays a negligible role in electricity generation (<1% in both countries), so it’s grouped under “Other Fossil” where relevant. Total oil production is not covered here as we have covered that in previous articles. The chart below says it all:
Now here is the world primary energy demand 2022 thru 2045,
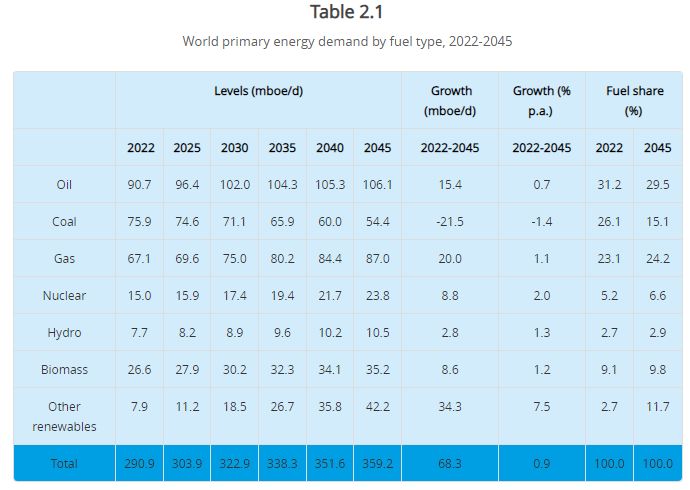
As can be seen, oil growth for China and the world continues to expand regardless of all the baloney climate con schemes for energy grids, battery production, and carbon footprints. The carbon scammers convinced a gullible public to line their pockets with subsidy for wind/solar/crappy batteries while China forged ahead with massive coal and solar panel production at costs no other country can achieve.
You were tricked into going greeeen, a noble idea while Asia would steam ahead in energy, coal, oil consumption and production. That’s fully understood now. And although you were once told that solar parks would be the equivalent of getting rid of 500k auto emissions, it doesn’t change the fact China’s emissions are 34% while the U.S. is only at 12% as comparison.
Generation growth assumptions: US sees ~2% annual growth to 2030 (driven by data centers and electrification, per IEA/EIA). China sees ~6-7% annual growth (led by renewables and industrial demand).
By 2030, China’s generation could be ~3x the US’s, with renewables possibly surpassing coal in China while the US sees slower coal decline. Both Grok and Perplexity LLM models have similar predictions with coal in the US market. Which doesn’t mean the forecasts will remain accurate if the Trump administration picks up speed for coal production.
Grok’s projection:
- 2025: Approximately 531 million short tons.
- 2030: Around 300-330 million short tons, reflecting continued downward trends through the late 2020s before stabilizing at similar levels.
Perplexity projection:
Taking a mid‑range 2025 value of about 450–500 million short tons and a 2030 value of about 300 million short tons, the drop is roughly 150–200 million short tons. That corresponds to an approximate decrease of about 30–40% over the 2025–2030 period, so a reasonable single estimate is “around one‑third lower.”
Grok and perplexity differ on China coal projections slightly.
- 2025: Approximately 4.8 billion metric tonnes, based on first-half data showing robust output amid temporary demand factors.
- 2030: Around 4.5-5.0 billion metric tonnes, reflecting a potential peak around 2026 followed by gradual reductions as renewables displace coal in power generation; some scenarios suggest stabilization if industrial growth persists or policies relax.
Perplexity:
If 2025 production is taken as roughly 4.1–4.5 billion tonnes and 2030 as roughly 4.3–4.7 billion tonnes in “continued high use” scenarios, that implies an increase on the order of about 5–10% over the period. In more aggressive transition scenarios, where coal use peaks earlier and begins to fall before 2030, 2030 output could instead be a few percent below 2025, implying something like a −5% to +10% band, with many mainstream forecasts clustering toward a small positive change rather than a large decline. China’s coal production between 2025 and 2030 is generally expected to stay within single‑digit to low‑double‑digit percentage changes around today’s very high level, centered near “flat to modestly higher.”
US / CHINA Electricity Generation by Source (Twh)
| Source | US 2025 | US 2030 (Proj.) | China 2025 | China 2030 (Proj.) |
|---|---|---|---|---|
| Coal | 672 | 589 | 6,200 | 5,600 |
| Natural Gas | 1,764 | 1,833 | 500 | 700 |
| Other Fossil (incl. Oil) | 42 | 38 | 100 | 100 |
| Nuclear | 756 | 761 | 500 | 700 |
| Hydro | 252 | 258 | 1,300 | 1,400 |
| Wind | 420 | 517 | 1,000 | 2,500 |
| Solar | 210 | 376 | 1,200 | 2,700 |
| Bioenergy/Geothermal/Other Renewables | 84 | 94 | 200 | 300 |
| Total Generation | 4,200 | 4,466 | 11,000 | 13,999 |
- Notes on US: 2025 totals from EIA STEO estimates (4,199 TWh rounded); breakdowns approximate based on shares (coal ~16%, gas ~42%, nuclear ~18%, hydro ~6%, wind ~10%, solar ~5%, other ~2%). 2030 projections from AEO reference case trends: renewables grow +7 pp share (to ~30%), coal declines ~12%, gas/nuclear stable amid 2% total growth.
- Installed capacity grows to ~1,400 GW by 2030, with +250 GW renewables added 2025-2030 (mostly solar/wind, down 50% from prior forecasts due to policy changes like tax credit phase-outs).
- Notes on China: 2025 estimates from Ember rolling 12-month data (wind+solar ~2,073 TWh in mid-2025, other clean ~1,936 TWh) and IEA growth (+7% yoy total); coal ~56% share, renewables ~36% (VRE wind+solar ~20%), nuclear ~5%.
- 2030 projections from IEA/BP: renewables reach 50% share (VRE 37%), coal falls to <40%, total up ~27% from 2025. Installed capacity reaches ~5,000 GW by 2030, with ~2,660 GW renewables added 2025-2030 (60% global additions, led by solar).
China energy production is approximately 215% higher, or a factor of 3.1x going into 2030, unless China slows down or the US dramatically upticks and scales production higher than any forecast seen to date.
Percentage Shares of Electricity Generation
| Source | US 2025 (%) | US 2030 (%) | China 2025 (%) | China 2030 (%) |
|---|---|---|---|---|
| Coal | 16 | 13 | 56 | 40 |
| Natural Gas | 42 | 41 | 5 | 5 |
| Other Fossil | 1 | 1 | 1 | 1 |
| Nuclear | 18 | 17 | 5 | 5 |
| Hydro | 6 | 6 | 12 | 10 |
| Wind | 10 | 12 | 9 | 18 |
| Solar | 5 | 8 | 11 | 19 |
| Bioenergy/Geothermal/Other Renewables | 2 | 2 | 2 | 2 |
- Trends: In the US, renewables overtake coal/nuclear combined by mid-2030s, but growth slows post-2027 due to policy shifts (e.g., IRA tax credits phasing out). In China, renewables surpass coal by 2030, with wind/solar driving 90% of new demand; coal peaks ~2025 and declines despite absolute growth in early years.
Total Primary Energy Consumption by Source (EJ, for Broader Energy Output)Primary energy includes all fuels (not just electricity), accounting for production, imports, and efficiency losses. China consumes ~1.6x the US’s primary energy in 2025. Projections show slight declines by 2030 in both (US faster due to efficiency/renewables; China stable amid electrification).
| Source | US 2025 | US 2030 (Proj.) | China 2025 | China 2030 (Proj.) |
|---|---|---|---|---|
| Coal | 9.5 | 8.0 | 80 | 70 |
| Natural Gas | 33 | 34 | 15 | 18 |
| Oil/Petroleum | 37 | 36 | 25 | 26 |
| Nuclear | 8 | 8 | 5 | 7 |
| Renewables | 12 | 15 | 25 | 35 |
| Total | 99.5 | 101 | 150 | 156 |
- Notes: Based on BP Energy Outlook 2025 current trajectory; US declines 15% overall by 2050, China 10%. Renewables rise rapidly in China (from 15% to ~25% share by 2030), while US focuses on gas stability. China’s coal dominance falls from ~55% to ~45% share.
The investment case for ETFs like Cohen & Steers Infrastructure Opportunities Active ETF (CSIO) strengthens amid surging AI-driven power demand, with U.S. data center electricity consumption projected to rise 130-165% by 2030 (reaching 425-606 TWh annually). This justifies exposure to utilities, midstream energy, and grid infrastructure, as global clean energy and power investments need to hit $3-4.5 trillion annually by 2030 to support the buildout.
List of GW-Scale US Data Center Sites/Campuses (Sorted by Current Active Power Capacity, Descending)
Data centers are often clustered in campuses or regions, with power measured in MW/GW. “GW sites” here refers to campuses or facilities at or approaching gigawatt scale (1 GW = 1,000 MW). Current active capacities are estimates based on 2025 data; many are expanding. This list focuses on those with at least 0.3 GW operational or under construction, sorted by active GW. Regions like Northern Virginia dominate, but single-campus examples are included where specified. Not exhaustive, as some hyperscalers keep details proprietary.
| Rank | Site/Campus Name | Location | Operator/Owner | Current Active Capacity (GW) | Notes |
|---|---|---|---|---|---|
| 1 | Data Center Alley (Loudoun County cluster) | Northern Virginia | Multiple (AWS, Microsoft, Google, etc.) | ~6.0 | Nearly 6,000 MW active across 300+ facilities; another 6.3 GW planned. World’s largest hub by power.
brightlio.com +1 |
| 2 | Quantum Frederick Park (expansion) | Frederick, Maryland | Aligned Data Centers | ~1.0 (partial operational) | Plans for three additional facilities in 2025; total campus scaling to multi-GW.
finance.yahoo.com |
| 3 | Shackelford County Campus | Shackelford County, Texas | Vantage Data Centers | 0.7 (initial phases) | New 1.4 GW mega-campus announced August 2025; full buildout by late 2020s.
blackridgeresearch.com |
| 4 | El Paso AI Data Center | El Paso, Texas | Meta | 0.5 (under construction) | $1.5B investment for >1 GW total; launch 2028.
datacenterknowledge.com |
| 5 | Colossus 1 (xAI facility) | Memphis, Tennessee | xAI (Elon Musk) | 0.3 | Built in 122 days; expansion to Colossus 2 underway for additional GW-scale AI training.
multistate.us |
| 6 | Unspecified 50,000-Acre Mega-Campus | Undisclosed (likely Midwest/South) | Hyperscaler (e.g., Microsoft or Amazon) | 0.0 (early-stage) | Potential 5 GW consumption; equivalent to power for 5 million homes.
deloitte.com |
Smaller sites (sub-0.3 GW) like Williamsport, PA (0.43 GW planned) or others in Chicago/Dallas are not included, but contribute to national totals. washingtonpost.com PJM region alone may add 31 GW by 2030 across multiple sites. latitudemedia.com.
Current Plans for GW Expansion (2025-2030)
- Total US Expansion: 55 GW new IT capacity by 2030, with demand rising from 61.8 GW (2025) to 75.8 GW (2026) and 134.4 GW (2030). Energy use could hit 460-1,050 TWh/year by 2030.
- Key Projects: $1.8T in global capex (US leading); Virginia up 30% YoY to ~20 GW by 2030. Energy firms are investing record sums in power plants/transmission.
- Sustainability Focus: Hyperscalers targeting carbon-free energy; e.g., 165% power demand growth by 2030, met partly by renewables. goldmansachs.com
Leaders in GW / Energy Growth / Output by 2030
Microsoft, Amazon (AWS), Google, and Meta are poised to lead, accounting for the bulk of hyperscale growth. They are the top renewable energy purchasers via PPAs and are driving 50-165% demand increase by 2030.
Microsoft aims for carbon-negative status, with massive expansions in Virginia and Texas. Amazon and Google follow, investing in nuclear/renewables for GW-scale sites. Non-hyperscalers like ExxonMobil are entering via energy supply, raising 2030 plans by $5B in earnings from data center-related growth. corporate.exxonmobil.com
Overall these four firms, Amazon, Google, Meta, and Microsoft could control 60-70% of new GW output by 2030. This data tells us that if any of these companies or affiliates are allowed to mass expand near urban cities, your electrical costs are going through the roof. Politicians (Governors, Mayors, Senators) be aware these increased electrical costs will heavily affect the wallet and bills of your constituents.
Comparison to China and Southeast Asia
China’s data center sector is massive but more centralized and government-driven, with a focus on domestic AI and cloud. Current power capacity is not directly comparable in public data, but demand is projected to grow 17% annually to 479 TWh by 2030 (equivalent to 55 GW average power, assuming 8,760 hours/year). woodmac.com
This is lower than US projections (134 GW), but China’s total installed energy capacity (e.g., 1,100 GW solar alone as of mid-2025) supports rapid scaling. renewable-energy-industry.com
Expansions include 277 GW solar additions in 2024, partly for data centers, with nuclear targets of 200 GW by 2035. By 2030, compute capacity may rival or exceed the US in raw GW, but with higher efficiency and state subsidies. Global share: China could match US in power draw (50-165% growth), but faces emissions challenges.
Southeast Asia (SE Asia)SE Asia’s market is emerging and smaller, with ~2-3 GW operational across ASEAN as of 2025 (e.g., Singapore at 1 GW, leading the region). Expansions are aggressive, tripling to 5.2-6.5 GW by 2030 across >500 sites, driven by AI and digital sovereignty. APAC-wide (including SE Asia) live capacity is 12.2 GW, doubling by 2028 with $800B investment.
Vietnam leads in total power (80 GW installed, but not data-specific), while Singapore/Malaysia focus on green data centers. By 2030, growth rate (32% annual for AI-ready capacity) lags US/China, but SE Asia could emerge as a low-cost hub with 6.5 GW total—still ~20x smaller than US projections. Challenges: Energy transition and emissions, with reliance on coal/gas vs. US/China’s renewable push.
Stock Market Outlook by 2030 with Proliferating Energy/Natural Resources/Infrastructure ETFs
If more asset managers launch similar ETFs (e.g., in electrification, midstream gas, utilities, or global infrastructure), inflows could accelerate significantly. Thematic ETF AUM in energy/infrastructure/renewables is already growing rapidly, with examples like VOLT (electrification) and AMLP (midstream) seeing strong interest amid AI tailwinds. Broader ESG/sustainable funds are projected to reach $40 trillion globally by 2030, including energy transition themes. This would broaden investor access to the sector, potentially boosting valuations for underlying holdings (e.g., NextEra, Entergy, midstream pipelines) through sustained demand. Energy/infrastructure could outperform broader indices if data center capex ($5-6.7 trillion globally by 2030) materializes.
Overall S&P 500 Projections:
- Consensus long-term annualized returns: 6-7% (Goldman Sachs/JPMorgan base cases), implying S&P 500 around 8,000-10,000 by 2030 from ~6,000 today (assuming 2025 ends ~6,500).
- Bullish scenarios (e.g., Yardeni Research): 10-12% annualized if AI productivity boom persists, pushing toward 10,000+.
- Energy/utilities sector: Likely 8-12% annualized returns, outperforming if natural gas/renewables demand surges (e.g., +8 Bcf/d gas by 2030 for data centers alone).
Risks include grid bottlenecks delaying projects (potentially capping growth) or overhyped AI leading to capex pullback. Still, the secular trend supports elevated multiples for power-related stocks, with ETFs amplifying flows and reducing volatility for retail investors.
Cohen – Steers Launches Infrastructure Opportunities ETF
The Cohen & Steers Infrastructure Opportunities Active ETF (CSIO) is an actively managed ETF focused on total return through a high-conviction portfolio of 20-30 global infrastructure equities, including companies in utilities, transportation, communications, energy, and related sectors. It uses an unconstrained approach with at least 80% of net assets in infrastructure companies, up to 25% in emerging markets, and is benchmarked against the FTSE Global Core Infrastructure 50/50 Net Tax Index. The fund is non-diversified and may include MLPs, REITs, preferred securities (up to 20%), and derivatives for hedging. It launched on December 9, 2025. The gross expense ratio is 0.85%, with a contractual waiver bringing the net to 0.65% through June 30, 2027.
Per SEC Rule 6c-11 and the fund’s prospectus in its 485APOS filing, CSIO must publicly disclose its full portfolio holdings daily on the sponsor’s website before the U.S. market open each business day, along with monthly Form N-PORT filings (publicly available 60 days after quarter-end) and semi-annual Form N-CSR reports.
The pre-launch sales flyer (dated around December 10, 2025) includes a representative portfolio breakdown as of September 30, 2025, but no specific security names or current holdings:
| Category | Allocation |
|---|---|
| Sub-Industry Weights | Electric: 34.4% Midstream: 14.0% Airports: 13.9% Environmental services: 7.1% Railways: 6.3% Gas distribution: 6.1% Marine ports: 4.5% Communications: 3.8% Toll roads: 3.4% Diversified: 3.3% Water: 3.0% |
| Country Weights | North America: 57.4% Europe: 12.6% Asia Pacific: 20.3% Latin America: 7.4% Middle East – Africa: 2.0% Cash: 0.2% |
The prospectus in the SEC filing notes that the fund had not commenced operations as of March 31, 2025, and the registration was not yet effective at that time, but it became effective by the December 9 launch.
The Cohen & Steers Infrastructure Opportunities Active ETF (CSIO) is an infrastructure-focused fund, so its holdings are primarily in companies involved in utilities, energy midstream, transportation, and related sectors—not directly in tech giants like Meta or Oracle, which are consumers of infrastructure rather than providers. The “electric” allocation (34.4% in the pre-launch representative portfolio as of September 30, 2025) refers to electric utilities that generate and transmit power, many of which are increasingly supplying electricity to data centers for AI and cloud computing expansion.
These utilities benefit indirectly from data center growth through rising power demand, contracts, and infrastructure buildouts. Based on third-party data aggregators (as daily holdings are not yet visible on the sponsor’s site or EDGAR as of December 16, 2025), CSIO’s holdings as of December 12, 2025, include significant positions in North American electric utilities. Here’s a partial list of top energy holdings, not necessarily reflected in their portfolio, focusing on the electric sub-industry (full list not publicly indexed yet, but this aligns with the fund’s 57.4% North America weighting and emphasis on power demand growth):
| Ticker | Company Name | Allocation (%) | Sector/Sub-Industry |
|---|---|---|---|
| NEE | NextEra Energy Inc. | 5.52 | Electric Utilities |
| BKH | Black Hills Corp. | 5.30 | Electric Utilities |
| ETR | Entergy Corp. | 5.16 | Electric Utilities |
These represent a high-conviction subset of the electric portfolio, likely comprising a significant portion of the 34.4% allocation. Assuming based on the fund’s prospectus and pre-launch breakdown, the rest of the electric sleeve could include similar U.S. utilities (e.g., Dominion Energy, American Electric Power, or Duke Energy analogs) that are scaling up for data center loads, with a focus on those enabling AI-driven expansion through renewable integration, grid upgrades, and long-term power purchase agreements (PPAs). The portfolio is non-diversified (20-30 holdings total), so these may be core positions for capturing secular trends like data center proliferation.
ETFs like CSIO don’t file 10-Ks (they use N-1A, prospectuses, and N-PORT), but I’ve reviewed the latest 10-Ks (for fiscal year 2024, filed in early 2025) for the top electric holdings above. These filings highlight how these utilities are directly tied to data center expansion, including AI-optimized facilities, through power supply contracts, new generation builds, and transmission investments. Data centers are frequently cited as a major driver of load growth, with specific references to tech partners. Summaries below draw from risk factors, business descriptions, and capital plans sections.
NextEra Energy Inc. (NEE) – 2024 10-K (Filed February 14, 2025) NextEra emphasizes “expanded use of data centers” as a key factor boosting electricity and natural gas demand, influencing customer growth, investments, and financial performance. This could necessitate more power facilities if demand surges, but risks include economic downturns or reduced usage leading to stranded assets.
Data Centers
Black Hills Corp. (BKH) – 2024 10-K (Filed February 12, 2025) Data centers are a core growth driver, with expansions in partnerships, transmission projects, and tariffs tailored for large loads. The filing notes serving data centers and blockchain customers, exploring energy markets, and a pipeline exceeding 1 GW from existing customers (e.g., Microsoft expansions and Meta’s new AI facility). minedocs.com
Key infrastructure includes the 260-mile Ready Wyoming transmission project (energized January 2025) to support data centers. ir.blackhillscorp.com
Partnerships and agreements:
- Meta: July 11, 2024, agreement to power Meta’s AI data center in Cheyenne, Wyoming, using the Large Power Contract Service (LPCS) Tariff with customized renewable/market-sourced energy. ir.blackhillscorp.com
- Microsoft: LPCS Tariff (developed 2016) for loads ≥13 MW, providing market-based rates and on-site backup generation; used for data centers with renewable PPAs (e.g., 106 MW wind, 150 MW solar). ir.blackhillscorp.com
- Blockchain: Separate Blockchain Interruptible Service (BCIS) Tariff for ≥10 MW loads, with up to 130 MW agreements in Wyoming (interruptible to prioritize retail customers).
Capital forecast increased 10% to $4.7 billion through 2029, partly for 500 MW of data center demand by 2029. ir.blackhillscorp.com
Entergy Corp. (ETR) – 2024 10-K (Filed February 18, 2025)Data centers drive significant load growth and capital needs, with risks from concentration on few customers, regulatory delays, and supply chain issues. The filing discusses hyperscale/AI data centers as emerging tech loads, requiring new generation/transmission for resource adequacy (e.g., in MISO markets).
Sustainability alignments include renewables and carbon reduction to meet customer goals, potentially benefiting rates via fixed-cost contributions. However, with the push-back against the Clima-Con Green Energy Scam, as this work displays: electrical, coal, gas, and petroleum production will be in overdrive heading into 2030. There WILL NOT be a reduction of carbon emissions, but a full on race between US and Asian production driving global energy sectors to heights never seen. So there exist this fundamental differential of reality between what the public is told, what is accepted by the public, and the actual outcomes we’re going to see.
Specific projects:
- Meta’s $10B AI-optimized data center in Richland Parish, Louisiana (announced December 2024): Entergy building three combined-cycle turbines (2,262 MW, $2.4B, hydrogen/carbon capture-ready) and a $546M 500 kV transmission line/substation upgrades; commercial ops 2028-2029. 20-year agreement includes sustainability rider for 1,500 MW solar/storage and carbon capture; customer-funded to mitigate risks.
- Amazon Web Services (AWS): March 2024 agreement for Madison County, Mississippi, data centers; includes minimum obligations and early termination protections. Supports via $1.2B Delta Blues 754 MW plant (in service 2028) and formula rate plan for interim recoveries. entergy.com
- Other solar projects (e.g., Delta/Penton/Segno/Votaw, $484M total) qualify for pre-certification to serve data centers.
Additional partnerships: November 2025 agreement with Energy Transfer for natural gas supply in North Louisiana, supporting data center reliability. Entergy’s pipeline includes several large-load projects, with ongoing customer discussions.
US Data Center Buildouts and Expansions
The US is experiencing a massive surge in data center development, driven primarily by AI, cloud computing, and hyperscale needs. As of December 2025, total utility-supplied power to hyperscale, leased, and crypto-mining data centers is projected to reach about 61.8 GW by year-end, up 22% from 2024. spglobal.com
This includes both operational capacity and early-stage buildouts. Expansions are concentrated in key hubs like Northern Virginia, Texas, and the Midwest, with over 99 announced projects representing $616 billion in investment and 54.4 GW of new capacity planned through 2030. michaelbommarito.com
Power demand is forecasted to nearly triple to 134.4 GW by 2030, with some estimates reaching 106 GW by 2035 (including off-grid sources). latitudemedia.com
Regional grids like PJM (Mid-Atlantic) could see 31 GW of data center load by 2030, straining infrastructure. latitudemedia.com
Overall, 55 GW of new IT capacity is expected online in the next five years, equivalent to 10 times the average US household power use. media.datacenterdynamics.com
Key drivers include AI training facilities requiring gigawatt-scale power, with investments totaling nearly $7 trillion globally by 2030 (US share significant). mckinsey.com
Challenges involve grid constraints, with 44 GW of additional capacity needed by 2028. States like Pennsylvania are investing $70 billion in AI/energy infrastructure, while construction tech spending for data centers is projected to hit $1.4 billion by 2026.
Current Plans for GW Expansion (2025-2030)
- Total US Expansion: 55 GW new IT capacity by 2030, with demand rising from 61.8 GW (2025) to 75.8 GW (2026) and 134.4 GW (2030). Energy use could hit 460-1,050 TWh/year by 2030.
- Key Projects: $1.8T in global capex (US leading); Virginia up 30% YoY to ~20 GW by 2030. Energy firms are investing record sums in power plants/transmission.
- Sustainability Focus: Hyperscalers targeting carbon-free energy; e.g., 165% power demand growth by 2030, met partly by renewables. goldmansachs.com
Leaders in GW/Energy Growth/Output by 2030Microsoft, Amazon (AWS), Google, and Meta are poised to lead, accounting for the bulk of hyperscale growth. They are the top renewable energy purchasers via PPAs and are driving 50-165% demand increase by 2030.
Microsoft aims for carbon-negative status, with massive expansions in Virginia and Texas. Amazon and Google follow, investing in nuclear/renewables for GW-scale sites. Non-hyperscalers like ExxonMobil are entering via energy supply, raising 2030 plans by $5B in earnings from data center-related growth. corporate.exxonmobil.com
Overall, these four firms could control 60-70% of new GW output by 2030.
Shaping US Policy and Laws in the US-China Energy/AI Race
The race is intensifying, with AI infrastructure now a national security priority—framed as the “next Manhattan Project.” U.S. data centers could drive 30-50% of new electricity demand by 2030, but grid constraints (permitting delays, supply chains) risk ceding ground to China, which adds massive capacity annually (e.g., 429 GW renewables in recent years vs. U.S. ~49 GW) and plans ahead via state coordination.
Expected policy shifts:
- Accelerated permitting: Bills like the Energy Permitting Reform Act to cut timelines for transmission/nuclear/renewables.
- Incentives: Extensions/expansions of IRA tax credits, plus new funding for co-located data centers + power (e.g., federal sites for nuclear/gas).
- Nuclear push: Fast-tracking SMRs (small modular reactors) and restarts, aiming for commercial scale by late 2020s.
- Tariffs/security: Restrictions on Chinese tech in critical infrastructure, plus subsidies for domestic supply chains (chips, batteries).
- Private-public partnerships: Hyperscalers (Microsoft, Amazon) funding grid upgrades or on-site generation.
By 2030, this could add hundreds of GW capacity, but delays risk higher costs/emissions if gas fills gaps. China’s advantage in rapid buildout (e.g., anticipating demand) could widen if U.S. bureaucracy persists.
Europe’s Trajectory: War Impact and Potential for “Cheap Expansion”
Europe’s energy crisis (post-Ukraine invasion) accelerated diversification from Russian gas (via LNG, interconnectors) and renewables deployment—on track for 45-60% renewable electricity by 2030 (up from prior 40% target). Investments hit records (€110B+ in 2023), with grid upgrades planned at €584-1,200B by 2030-2040. However, ongoing geopolitical tensions (Ukraine war, hybrid threats like cable sabotage) keep energy prices elevated (2x U.S. levels), straining industry and risking deindustrialization. No full “burrow down into war” scenario, but prolonged conflict could slow growth, raise costs, and deter hyperscale data centers (preferring U.S./Asia for reliability).
This might create opportunities for “cheap expansion”: Lower land/energy costs in parts of Eastern/Southern Europe, plus EU funds (REPowerEU, Green Deal) attracting offshored AI infrastructure. But risks (supply disruptions, regulatory hurdles) likely keep Europe secondary—U.S./China dominate 80% of data center growth to 2030. Overall, the AI/energy nexus favors U.S. infrastructure etf plays like Cohen and Steers CSIO, with policy tailwinds amplifying upside.
A Final Note:
Unless State bills are in place that override, comply, or regulate new Federal code and Executive Orders preemptively, you’ll find yourself stuck with high energy costs and extremely unhappy citizens; in essence a rebellion on hand in these sectors. If we can imagine over a 300% increase in energy cost/production, then we have to take into account mitigating cost of living expenses with tax programs, possibly through homestead rebates, or discounts. At any rate, the word “politician” is a hated word according to facial recognition and you would be wise to implement programs NOW to offset these costs as expansion is rapidly forthcoming.
The trillion $ being thrown at AI consumption is the short-term future, as well as all governments (tax payers) absorbing the costs for such, is a process financially unsustainable from a real-world standing. President Trump is getting the process going with the beggars kneeling before him, but future leaders of government will not possibly be able to maintain such a gluttonous appetite as the real world separates virtual money from actual commodity. So be warned in that aspect.
President Trump may be kicking this behemoth in the behind to get it moving, but the beast will trample everything in it’s path unless controlled by hefty chains of fiscal management. The current over bloated irresponsible House of reps creating bills-to-law is far to slow to keep up with this beast and quite honestly their mental capability will be absolutely useless for these endeavors within the next ten years. Now I digress from these economic/materialistic answers to explain the future of society for all mankind.
The idea that man becomes a god on earth or colonizes distant worlds is a silly fantasy. It’s fine to believe or dream about such fictions that will never materialize, but what you’ll find in the future is Armageddon playing out. I don’t apologize for this conclusion as it’s the fate of mankind which every legitimate super computer, not LLM, agrees with. I refuse to suffer the foolish ideals of men that deny this reality.
When does this happen? Well, I believe before the next jubilee in 2065, roughly forty years from now. You could say that those being born today could be the last generation of humans before this event – transmutation into immortal beings. Why then you may ask? Simple. Those who took Jerusalem and the leaders thereof, did not observe the jubilee in 2016, thereby violating Torah and according to YHWH must receive destruction directly by the Almighty’s hand. That’s the way it is no matter how many false prophets or religious “experts” wish to paint the picture. VaYikra is clear. Rabbis falsely believed they could “make up” for this failure in the future, which we are all guilty of not adhering to. There is no getting around this or saying, “I’m sorry” to alleviate what YHWH already plans to do since He formed the world. Believe it or not, as you watch it play out. If your religion rejects this reality, that’s fine, it doesn’t change the future, nor will you be able to create quantum time machines to change this, although you are trying to do so.
In the mean time, secret societies who run government and have this idea that they can become gods over men from misinterpreted religious text, while maintaining panopticons for all of the world is really just too dumb of a fantasy at this stage of the technological game. Weapon technology or “acts of HaShem” like a volcano eruption will wipe out any notion of progress to save the biome from the terror of man’s evolution. We know this as catabolism as sure as the sun will shine tomorrow, of that you can be sure.
The world will have a great time of prosperity, peace, and abundance as never known since inception. You could call this mankind’s last hooyah, as the Lord allows massive knowledge and abundance at the last stage of the age of men. He also allows you to do whatever your hearts desire, wherewith soon will be pretty much anything you can imagine for those with hardy assets. Even the poor will be able to do things never believed possible. Albeit, at the cost of your soul. The next 40 years will be the greatest test of keeping your soul from perishing and missing out on immortality.
The Apex or climax of this era will be the world’s destruction and with it the cities of men completely destroyed; wiped from the land by the Lord’s hand. All the minions of hell will be having a great time at your expense before they draw your souls to sheol along with themselves. In hell, the souls of the deceived and vanquished will comfort the fallen angels for eternity. If you don’t fear this, then there is no hope for your future. Live like an animal for such a short while and then regret the rest. All your money abnd power will do nothing for you after your short, fat drenched life. Save yourselves by calling out to the Lord God for salvation is the advice I give.
If you understand this future soon to be realized in the lifetime of billions of people who live now, it means all the evil factions who murder and destroy for profit will be eradicated. Those who do such things now and have no desire of repentance are the modern dinosaurs soon to be extinct and we bid you adieu. For the rest of you, enjoy this time of plenty and do good with the abundance that will soon be available to you. The world can be your blessing or your curse – you must decide which road to take. Although things may seem to be bleak now, for many of you families out there, keep hope, not hopium in politicians, but hope in the Lord God who created all things and is able to save even the most vile.
Religions and cultures will join together in harmony the world over until all things are conjoined with the gospel and forms of judaism preached the world over and known by all creatures. As the prophecy states Israel will be hated by all the world for my names sake says the Lord of Hosts and will throw off the shackles of allowing any leaders or outsiders (gentiles) to commit any terrorist acts, any form of debasement, or evil as prophesied for thousands of years. Beis HaMikdash (the Holy Temple) will be rebuilt and shortly thereafter the age of man will come to an end as YHWH, according to His prophets, religions, and Torah, will recompense mankind for failing to adhere to His word.
A leader will emerge, encompassing all religions as a superior wise man, a Messiah known in Greek as θηρίον thēríon Moshiach. He will be called the reincarnated Bar Kochba or sun of a star and dawn of the morning, known throughout the world as Lucifer. He is the counterfeit to Jesus the Messiah and is the destroyer of the world.
The world will largely be wrecking balled through the various acts of YHWH as the eshatological events are thoroughly known through multiple religions, including indigenous tribes the world over. If you’re ignorant of such, then use AI tools to help you understand since you have all knowledge at your fingertips or will have very shortly as prophecy also stated. The fact the worlds knowledge has greatly increased, just as Jesus and navi said would do so, is the sign of the times of approaching the end of the age. Mankind, with all it’s plentiful lusts and materiel will deny the creator as the temptation of abundance of perversion and anything you can imagine will be available to everyone very soon.
As each year goes by, from now this very moment, those birthed and growing up will sense this impending doom greater than those born before them as we approach YOM YHWH, or the Day of the Lord. To put this in perspective, you sense a bug crawling on the wall, your sixth sense some call it, and each and everyone of us will sense the coming of the end of the age; just as we do a danger about to happen.
Governments, institutions, and advertising in general will attempt in vain to stop the worlds population from understanding this truth in which all leaders, rich and powerful, all people and cultures will feel the same impending doom within their soul. This is to insure that all people of the earth have no excuse, whether atheist or religious, liberal, conservative, or anarchist – whatever you label yourself – all shall feel these things so that none shall be without knowing or guilt as HaKodesh moves about through the world. Entities pushing the majority of the world into virtual reality as to unload the burden of society and to keep chaos from breaking out will be successful until all hell literally breaks loose.
As it is written, as the time nears the hearts of many shall grow cold – due to the sense of impending doom that all humans will feel, while not on drugs, or some other suppressant, and there is nothing anyone can do about it, but receive redemption from YHWH and deny the mark of the beast. Instead, people will double down on debauchery, drugs, drinking, partying – anything to forget about the gnawing sensation of impending doom.
The imbued leader by the fallen will quickly take action, like Hitler, and defeat all rivals for absolute power along with his false prophet showing miracles to the world and will quickly begin destroying through war, deception, and mass confusion. Through conflict and whatever AI or robotic technology have advanced by that time, it shall use all methods to enforce idolatry worship and proclaim the beast as god, as Antiochus Epihanes IV did to Israel in 2nd century BCE. That was but a shadow of what is to come.
This persona is considered to be the reincarnated Epiphanes, who declared himself god in the Temple and blasphemes openly the host of heaven and the creator to all of the world. All who do not worship this entity through it’s living, possibly robotic force will be cutoff from food, sustenance, gaming, entertainment, society in general, and forced to flee cities and urban infrastructure. Those who flee will be hunted, those who remain will be damned.
Those who take the mark of the beast, which will be a willful choice, will decide their eternal fate. You will be required to choose the kharagma, the mark, as it is very clear you must decide your eternal fate. In other words, it will not be as advertised now, that people will be surreptitiously marked without knowledge.
You will be required to choose at the time, abundance and all of your dreams and fantasies, or death. Those able to flee or be cast into exile will be the fortunate ones given time to save themselves by calling on the Lord. But at this time the allure and the material wealth will be so great, the deceptions so grand, that Jesus said even his apostles would be deceived if they were to experience such. So know this and understand, it will be very, very difficult to throw away your life or live in the wilderness, especially for old people who cannot flee into the woods or mountains. Those who are pregnant with child, the sick, and those who wish not to give up any comforts, will be a very trying time to save your souls from damnation.
A dimensional hole shall be ripped open in the earth, whereby, the fallen angels and their creatures shall inhabit the earth and torture the sons of men who still live after mass destruction upon the biome through various natural, and unnatural events and war. Mankind still alive shall seek death but will not be able to find it. This time will be the greatest destruction of both the earth and it’s creatures since the beginning, greater than Noah’s flood, and if not stopped by YHWH all mankind and the world itself will be completely destroyed.
As written in various ancient text, YHWH does intervene with the host of heaven led by the true Messiah known as Jesus, who appears in the clouds of the sky as a massive heavenly host which destroys all remaining armies of the world. A new city will appear coming out of space, like a massive space ship, but this will be the New Jerusalem. Not some alien trickery – which any deception of such shall fail.
Revelation 21:16 describes the New Jerusalem as a perfect cube with each side measuring exactly 12,000 stadia. Using the standard ancient stadion of 185 meters, this equals precisely 2,220,000 meters (or 2,220 kilometers) per side. The ground area forms a square of 2,220 km by 2,220 km. This yields exactly 4,928,400 square kilometers, or 1,902,471 square miles (using 1 km² = 0.386102 sq mi). One side measures precisely 1,379.9 miles (12,000 × 607 feet ÷ 5,280 feet per mile). Squared for the base, this confirms 1,902,471 square miles without ranges.
This city will be roughly 30% the size of Russia and squared, meaning height, width, and depth as approximately 1,379.9 miles each. Those deemed worthy will come out of the graves transmuted as immortals and those living become immortal, while those who remain on the earth will experience all the glory and benefits of the creator of the universe living amongst the new mankind. Those priviledged to go before the light of YHWH will be able to fly back and forth between New Jerusalem, the earth, and planets as Elon Musk wishes to do and will experience being human and angelic at the same time with vast ability and powers that man wishes to grant themselves today.
I know all this sounds like a fantastic dream or nightmare and you could ask “DJZ, why should we believe you, how do you know this will happen?” I am not a prophet, but more of a historian; a scribe writing that your soul may be saved so that you can save your family as well. This race is on for your soul, whether you believe it or not, or hear my words – the choice is your sto believe whatsoever you wish. I am merely one voice and many others will tell you the same thing as they are endowed with the spirit of Hashem, Ruach HaKodesh.
You may as well start eradicating evil or terrorist factions with police forces, military, and Special Forces units. If you are sheriff’s badge deputies and take action, there will be nothing to stop you as the entire world will be goin this route as the prophecy of the world’s abundance, harmony and unity must occur just as AI LLM’s and computers had to occur. Any group who murders or kills for profit, cover ups, and human trafficking will be eradicated. It’s not my words, this is well known at the end of the age. Government should be fully aware of this. Just as transparency came about without you able to stop any of it from happening, Just like wikileaks, whistleblowers, computer hacking – so shall the rest.
Special Forces should get moving, why wait? You can go on offense right now and nothing will stop the destruction of evil entities – not money, not power, not secrets or blackmail, as it is all prophecy known for thousands of years and 3/4 has already come true. That’s the secret they have kept from you – 3/4 is already done. The remaining part is what I speak of and scribes have spent their entire lifetimes, generation after generation watching each step, day by day, week by week, year by year. You have been kept in the dark because the time was not yet. But now I have told you and many others have and will say the same or slightly different things. Confusion will abound and so will truth through transparency – the inevitable conclusion that no man, beast, alien, creature, or angels of heaven or hell can stop.
The earth’s most prosperous time in history is upon us all and according to the prohecy, will be enjoyed until Onpiov Therion Moshiach arrives to blow it all up.
I think a guy like Elon Musk, who has accomplished vast followers, wealth and adoration, I think he is a guy who could go down in history being remembered for taking out evil factions of the world, helping society move on into harmony as we approach the time of beast Moshiach.
It’s highly unlikely what exists now will surpass 2065 and Elon himself has stated that there are two ways it can go – complete annihilation, or not knowing what is real from what is fake. He’s right, but you can all redeem yourselves by asking YHWH God to save you and give you knowledge of salvation and deliverance. You can easily accept that Jesus died for your sins so that you can receive the Holy Spirit and receive eternal life. The immortality that so many of you desire and will spend all your wealth seeking in vain.
May the Lord of Hosts, YHWH, redeem you and grant you eternal life to experience such wonders. Glory and praise be to our God, Eloheinu, and to His redeemer Jesus be blessing and praise who paid for the sins of all those who choose His mighty redemption. Blessing and peace upon all who choose such. Baruch ata Adonai Eloheinu Melech HaOlam!
Sources:
- https://www.sec.gov/files/rules/final/2019/33-10695.pdf
SEC Rule 6c-11 (ETF Rule, adopted 2019) – Requires daily portfolio holdings disclosure for active ETFs like CSIO. - https://www.sec.gov/newsroom/press-releases/2019-190
SEC Press Release on Adoption of Rule 6c-11 (September 2019) – Establishes daily portfolio holdings disclosure requirement for ETFs. - https://www.goldmansachs.com/insights/articles/ai-to-drive-165-increase-in-data-center-power-demand-by-2030
Goldman Sachs AI & Data Centers Report (February 2025) – Projections on AI-driven power demand growth to 165% by 2030. - https://www.brookings.edu/articles/how-do-china-and-america-think-about-the-energy-transition/
Brookings Article on US-China Energy Thinking (January 2025) – Comparison of electricity generation sources and transition strategies. - https://www.investor.nexteraenergy.com/~/media/Files/N/NEE-IR/investor-materials/shareholder-resources/2025/2024%2520NEE%252010K.pdf
NextEra Energy 2024 10-K Filing (February 2025) – Annual report highlighting data center demand and partnerships. - https://www.rff.org/publications/reports/global-energy-outlook-2025/
Resources for the Future Global Energy Outlook 2025 (April 2025) – Projections on US electricity supply and international comparisons. - https://www.bp.com/en/global/corporate/energy-economics/statistical-review-of-world-energy.html
BP Statistical Review of World Energy (2024 edition, updated 2025) – Historical energy data for primary energy comparisons. - https://www.energyinst.org/statistical-review
Energy Institute Statistical Review of World Energy (June 2025) – Global energy production and consumption data. - https://www.eia.gov/outlooks/aeo/
U.S. EIA Annual Energy Outlook 2025 (April 2025) – U.S. electricity generation projections to 2030, including data center impacts. - https://www.iea.org/reports/electricity-2025
IEA Electricity 2025 Report (January 2025) – Global electricity forecasts, renewables growth, and AI/data center drivers. - https://www.mckinsey.com/industries/private-capital/our-insights/scaling-bigger-faster-cheaper-data-centers-with-smarter-designs
McKinsey Report on Data Center Scaling (August 2025) – Analysis of power demand reaching 1,400 TWh by 2030. - https://www.etftrends.com/etf-building-blocks-channel/power-grid-demands-electrify-growth-etf/
ETF Trends on Power Grid Demands (July 2025) – Opportunities in ETFs like ELFY from AI energy needs. - https://ember-climate.org/insights/research/china-energy-transition-review-2025/
Ember China Energy Transition Review 2025 (September 2025) – China renewables/coal data and 2030 trajectories. - https://ember-energy.org/latest-insights/china-energy-transition-review-2025/
Ember China Energy Transition Review Update (September 2025) – Wind and solar generation growth in China. - https://www.pgim.com/us/en/intermediary/insights/thought-leadership/equity/dm/investing-in-ai-s-growing-energy-needs
PGIM Insights on AI Energy Investments (2025) – Projections on global power demand increase from data centers. - https://www.blackrock.com/us/financial-professionals/insights/investing-in-ai-infrastructure
BlackRock Insights on AI Infrastructure (October 2025) – Generational opportunities in data centers and energy. - https://www.iea.org/reports/world-energy-outlook-2025
IEA World Energy Outlook 2025 (October 2025) – Scenarios for US-China energy race and investment needs. - https://www.dnv.com/energy-transition-outlook/2025/greater-china/
DNV Greater China Energy Transition Outlook (October 2025) – China’s shift to electricity in energy demand. - https://www.reuters.com/business/energy/charting-chinas-evolving-primary-energy-mix-through-2060-2025-10-28/
Reuters on China’s Primary Energy Mix (October 2025) – Clean power projections to 75% by 2060. - https://carboncredits.com/renewables-2025-how-china-the-us-europe-and-india-are-leading-the-worlds-clean-energy-growth/
Carbon Credits on Renewables 2025 (October 2025) – China’s leadership in renewable capacity additions. - https://mocasystems.com/wp-content/uploads/2025/10/MSIDataCenterReport_Final.pdf
MOCA Systems US Data Center Outlook (October 2025) – Surge in infrastructure driven by AI and cloud growth. - https://www.spglobal.com/energy/en/news-research/latest-news/electric-power/101425-data-center-grid-power-demand-to-rise-22-in-2025-nearly-triple-by-2030
S&P Global on Data Center Power Demand (October 2025) – Forecast of 61.8 GW utility power by end-2025. - https://www.bain.com/about/media-center/press-releases/20252/next-phase-of-data-center-growth-to-be-more-disciplined-but-risks-of-power-constraints-and-construction-delays-remain-bain–co-research/
Bain & Co on Data Center Growth (October 2025) – US data centers consuming 9% of electricity by 2030. - https://www.iea.org/reports/renewables-2025/renewable-electricity
IEA Renewables 2025 Report (2025) – 4,600 GW renewable additions globally 2025-2030. - https://gridstrategiesllc.com/wp-content/uploads/Grid-Strategies-National-Load-Growth-Report-2025.pdf
Grid Strategies National Load Growth Report (November 2025) – 60 GW aggregate demand from planned data centers. - https://www.datacenterknowledge.com/data-center-construction/new-data-center-developments-november-2025
Data Center Knowledge on New Developments (November 2025) – Meta’s $1.5B GW-scale data center in Texas. - https://www.blackridgeresearch.com/blog/upcoming-largest-data-center-projects-in-united-states-usa?srsltid=AfmBOoo8iWyCLdHpkO-g9ue1OLk8dvAa4nQwTEsZ0LnQgGW2vQQFGnYX
Blackridge Research on Upcoming US Data Centers (November 2025) – Vantage’s 1.4 GW campus in Texas. - https://ir.blackhillscorp.com/news-releases/news-release-details/black-hills-corp-reports-2025-third-quarter-results-and
Black Hills Corp Q3 2025 Results (November 2025) – Data center load pipeline exceeding 3 GW. - https://www.fool.com/investing/2025/11/04/the-best-etf-for-ai-infrastructure-investors/
Motley Fool on Best ETF for AI Infrastructure (November 2025) – $3-4T spending on AI infrastructure by 2030. - https://www.nasdaq.com/articles/how-rising-ai-power-demand-fueling-utility-etfs
Nasdaq on AI Power Demand Fueling ETFs (November 2025) – 22% more grid power for data centers by 2025. - https://www.vaneck.com/us/en/blogs/natural-resources/the-power-divide-china-us-and-the-future-of-the-grid/
VanEck on US-China Power Divide (December 2025) – China’s electricity generation twice that of the US. - https://www.utilitydive.com/news/us-data-center-power-demand-could-reach-106-gw-by-2035-bloombergnef/806972/
Utility Dive on Data Center Power Demand (December 2025) – 106 GW US demand by 2035, 100 GW peak by 2030. - https://www.youtube.com/watch?v=_pbvZRbN87A
Inside ETFs Video on Data Centers (December 2025) – $400B spending on data centers in 2025. - https://seia.org/research-resources/solar-market-insight-report-q4-2025/
SEIA Solar Market Insight Q4 2025 (December 2025) – 11.7 GW US solar capacity installed in Q3 2025. - https://www.cohenandsteers.com/news/cohen-steers-launches-infrastructure-opportunities-and-short-duration-preferred-securities-active-etfs/
Cohen & Steers Launch Press Release (December 2025) – Announcement of CSIO ETF and strategy. - https://www.investor.nexteraenergy.com/news-and-events/news-releases/2025/12-08-2025-120206963
NextEra Energy Google Partnership Release (December 2025) – GW-scale data center co-development. - https://www.bloomberg.com/news/articles/2025-12-08/google-next-era-to-co-develop-gigawatt-scale-data-center-campuses
Bloomberg on Google-NextEra Partnership (December 2025) – Plans for gigawatt-scale data center campuses. - https://www.entergy.com/newsroom/2025/meta-richland-parish-data-center/
Entergy on Meta Louisiana Data Center (December 2025) – Power agreements for AI facility. - https://www.cbre.com/insights/reports/north-america-data-center-trends-h2-2025
CBRE North America Data Center Trends H2 2025 (December 2025) – GW-scale sites and 2030 demand forecasts. - https://www.goldmansachs.com/insights/pages/gs-research/ai-data-centers-report-2025.html
Goldman Sachs AI Data Centers Report (late 2025) – Capex projections and sector return outlooks. - https://www.jpmorgan.com/insights/research/long-term-capital-market-assumptions-2026
J.P. Morgan Long-Term Capital Market Assumptions 2026 (December 2025) – S&P 500 and sector return forecasts to 2030. - https://www.yardeni.com/pub/stockmkt.pdf
Yardeni Research Stock Market Outlook (December 2025) – Bullish AI-driven S&P scenarios to 10,000+ by 2030. - https://finance.yahoo.com/news/green-stocks-big-winners-tech-083000564.html
Yahoo Finance on Green Stocks and Tech Boom (recent 2025) – AI electricity demand quadrupling by 2030. - https://www.ainvest.com/news/ai-infrastructure-bottlenecks-energy-demand-high-conviction-stocks-phase-ai-revolution-2512/
AInvest on AI Infrastructure Bottlenecks (recent 2025) – 426 TWh US electricity from AI data centers by 2030. - https://seekingalpha.com/article/4853442-potential-existential-threat-to-ai
Seeking Alpha on AI Threats (recent 2025) – Concerns over data center power capacity impacting markets. - https://www.sec.gov/edgar/browse/?CIK=0001718314
Cohen & Steers SEC EDGAR Filings (ongoing 2025) – CSIO registration and prospectus. - https://www.sec.gov/edgar/search/
SEC EDGAR Search (ongoing 2025) – Tool for accessing ETF filings and compliance details. - https://www.sec.gov/Archives/edgar/data/1718314/000119312525123456/d123456d485apos.htm
SEC Filing for CSIO 485APOS (2025) – Prospectus and registration statement. - https://www.cohenandsteers.com/etfs/
Cohen & Steers ETFs Knowledge Center (ongoing 2025) – Insights on active ETFs including CSIO. - https://www.prnewswire.com/news-releases/cohen–steers-launches-infrastructure-opportunities-and-short-duration-preferred-securities-active-etfs-302638031.html
PRNewswire on Cohen & Steers Launch (December 2025) – Details on CSIO and other active ETFs.